$ 40030000
Wrongful Death
California is the most populous state in the country. As a result, car accidents are more prevalent here than in many other states.
Our infographic below illustrates the frequency of car accidents in this state.
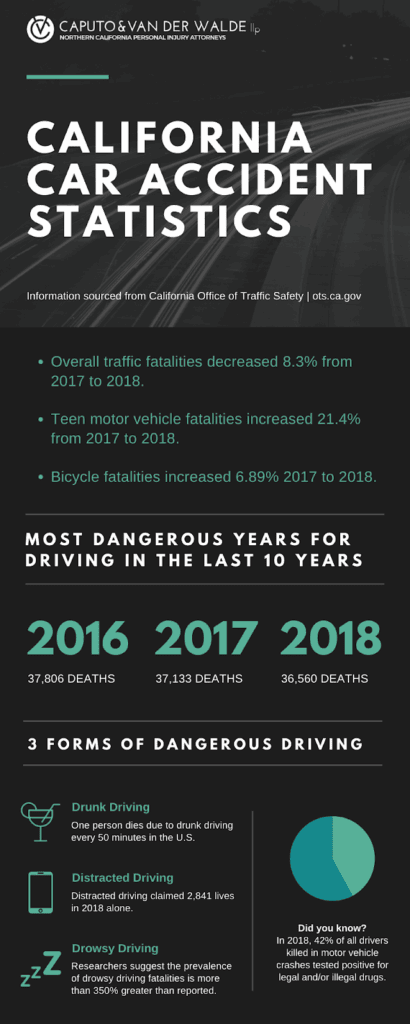
Information Sourced from California Office of Traffic Safety
If you or someone you love has been injured in a car accident, our San Jose personal injury attorneys can protect your rights while you focus on recovering from your injuries. We have a track record of success in recovering significant settlements and verdicts for our clients, and we’re here to do the same for you.


As members of the Multi-Million Dollar Advocates Forum® and the Million Dollar Advocates Forum®, we have proven our ability to negotiate and litigate on behalf of our clients successfully. Retain us to put our tactical strategies to work for you. These skills are what make our legal team such a formidable opponent in any courtroom or negotiation setting.